Urban Park Design

Large, native vegetation green spaces like urban parks are critical to biodiversity because they provide habitats for many species, many of which are not suited to survival in typical urban settings.[1] Reviews of park statistics across multiple countries conclude that park size is positively correlated with species richness.[2],[3] In addition to park area, park distribution is an important consideration because park isolation has an inverse relationship with species richness.[4]

Terratopia’s city design draws from the following sample designs to strike a balance between large park size and even park distribution. 

“Park Results” for Minneapolis: 98.1% of residents are within a 10 minute walk of a park. 7,831 people are outside a 10-minute walk of a park, from a total population of 421,169.
Figure 1. A zoomed in map of Minneapolis, Minnesota on the Parkscore website showing the parks highlighted in dark green and the residents with close proximity to them highlighted in light green.[5]

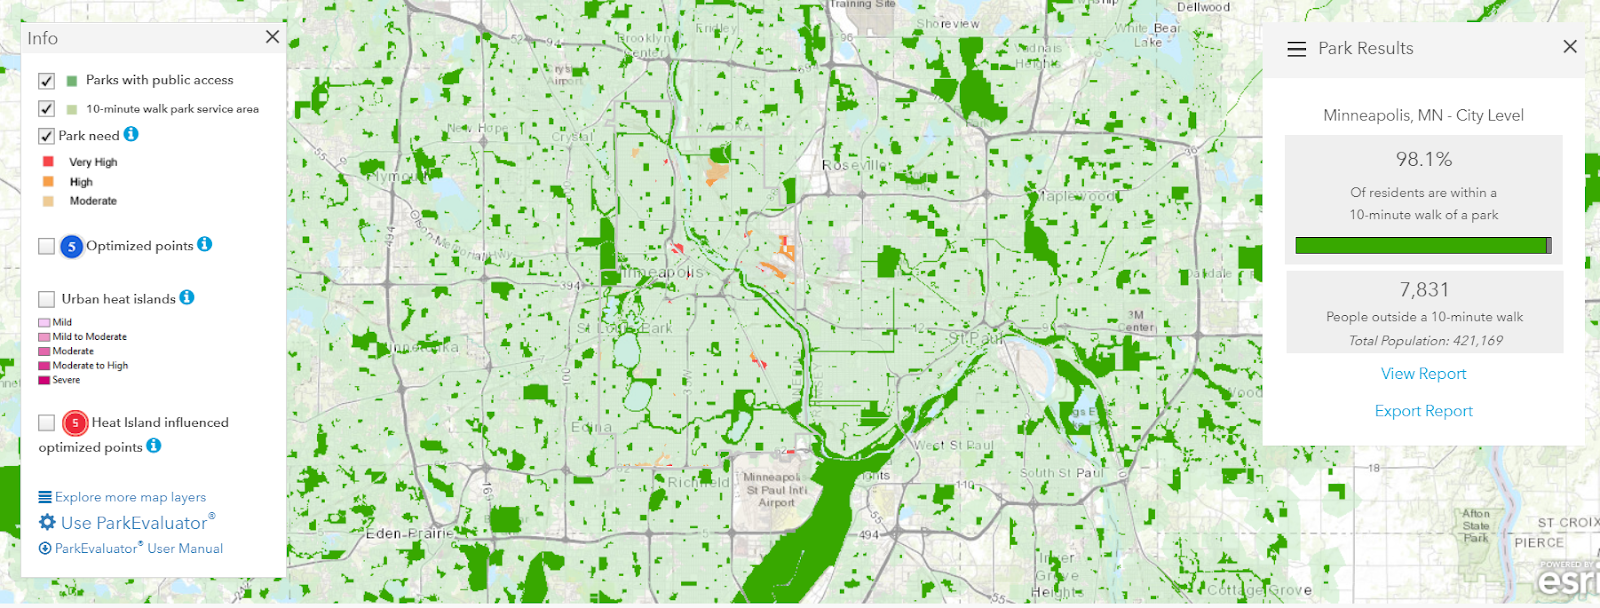
Parkscore is a nonprofit tool that rates cities based on the distribution of their parks, namely the amount of people within ten minute walking distance to a public access park. This metric is a suitable proxy for the guiding criteria of even distribution and minimized isolation. The top rated city on the tool is Minneapolis, MN.[6] Therefore, this low isolation design best demonstrates optimal park distribution. The area of Minneapolis is 53.97 square miles, 15% of the city land is dedicated to parks and recreation, and the city contains 269 parks in total.[7],[8] This places the average size of each park at around .03 square miles. Incidentally, Minneapolis has a higher average park size than the other top five scoring cities, making it a model example for park area as well.[9]

Beyond these high proximity parks, to make sure that a sufficiently large habitat is preserved, the city will maintain a one square mile central park in the city center. The feasibility of this is modeled after the existence of the much larger Central Park in New York City.

Cost of Park Maintenance

While there is a high variability in maintenance costs, averages across cities remain useful. According to a review of 40 municipalities in the Veneto, Italy (1997) park maintenance costs averaged 1.10 euros per square meter and varied between € 0.39 to 2.73 per square meter.[10]

A separate study in 2002 reviewed 15 parks in the United Kingdom, reporting a variation between € 0.28 to € 1.34 per square meter.[11] Finally a 2018 study of urban parks in São Paulo, Brazil reports maintenance costs of about $2.10 per square meter.[12] By adjusting for inflation and currency differences, the resulting range of costs across these reviews is $0.40 to $5.08 per square meter per year.[13],[14]

Connectivity Designs

Connectivity is another crucial element to greenified city planning as it allows gene flow between larger greenspaces like natural parks, making urban animal populations more resilient.[15] Connectivity can come in many forms, providing many opportunities for city specific planning.

Urban Tree Cover

Tree cover is a very versatile form of connectivity that has a large impact without requiring major structural change to the city layout. Most impactful to birds, high tree density throughout urban areas can bolster native bird populations by providing stopping points between more substantial green spaces.[16]

The vast majority of Tampa’s streets' Green View Indexes are in the 45-60% range. Large connective streets and the city center have lower Green View Indexes.
Figure 2. Map of Tampa displaying Green View Indexes, which is the percent of tree canopy coverage at a location.[17]

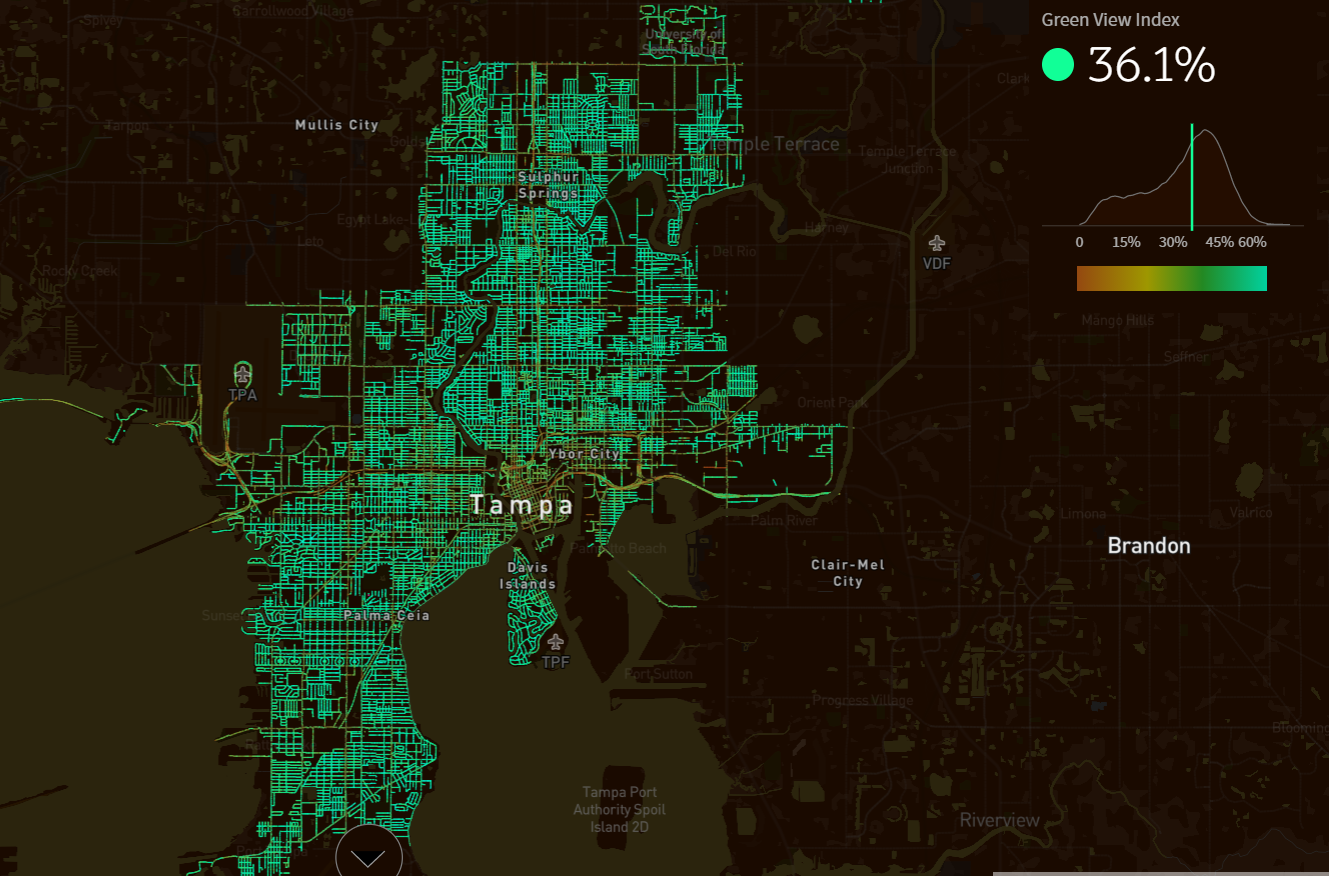
A powerful sample design, the city of Tampa has the highest tree cover of the cities evaluated by the MIT tool Treepedia.[18] With 21% of land area having right of way (publicly provided) tree cover, this design is within feasibility for Terratopia.[19]

Cost of Tree Cover Projects

According to a 2018 study from the University of Massachusetts at Amherst, the cost of planting white and red oak trees with direct planting is $4.38/tree.[20] According to another study, per-tree maintenance costs range from $0.17 to $6.84 in 2006, or $0.10 to $4.00 in 1999.[21] Averaged and adjusted for inflation, these values result in a planting cost of $4.60/per tree and between $0.22-$8.98 per tree per year for maintenance in 2020.[22]

Park Connecting Corridors

A map of the West Loop Park Connector in Singapore. This park connector connects many different parks in miles of corridors
Figure 3. West Loop Park Connector in Singapore and the various parks and junctions it contains.[23]

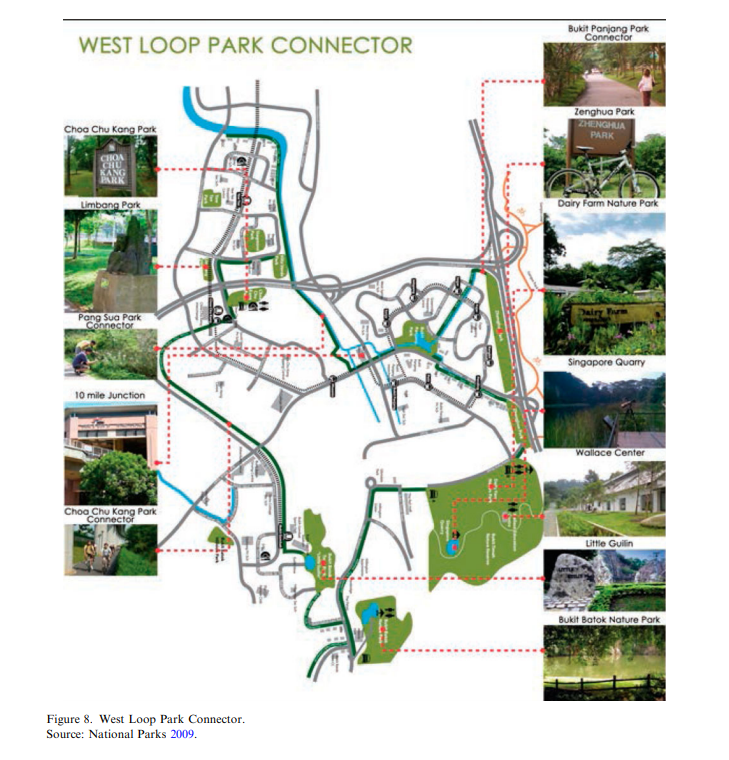
The West Loop Park Connector is a corridor that connects several parks in Singapore, allowing both pedestrian movement as well as animal movement due to the intentionally heavy vegetation density. Begun in 1995 and currently a work in progress, it will eventually become 300 kilometers in length.[24] As of the 2021 budget, the projected total cost of the project is $154,613,000, which translates to a cost of around $515,400 per kilometer.[25]
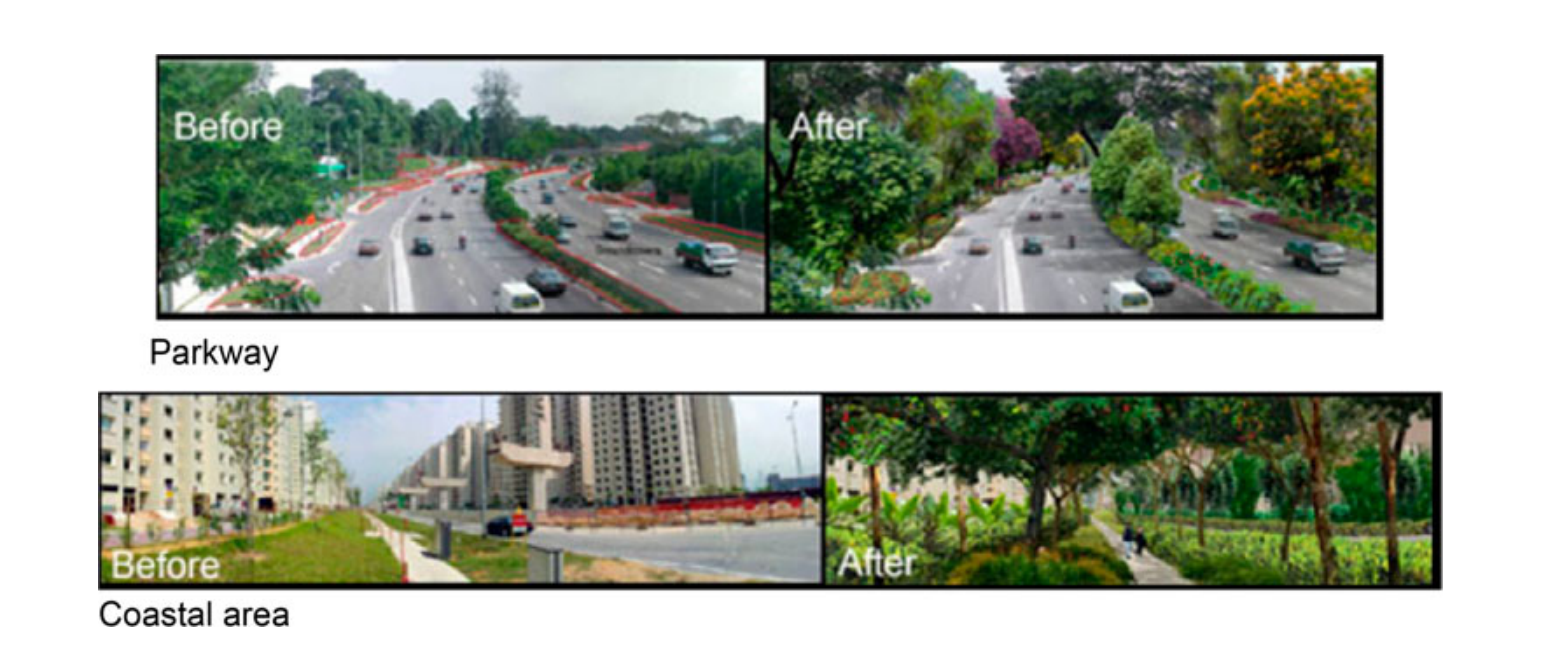
A photograph of Singapore’s Park Connector Network. Two women walk down a bridge surrounded by lush greenery both above and below.
Figure 4. Singapore’s Park Connector Network.[26] 
Before and after images of parkway and coastal areas (in Singapore?). The before picture for parkways shows a two-way highway with some bushes on the sidewalks and island. The after photograph shows the same road with denser greenery and more diverse trees and bushes. The before picture for a coastal area shows a walkway with sparse trees and grass, while the after picture depicts the same walkway with fruit-bearing trees and different types of bushes and plants lining it.
Figure 5. Before and after images of parkway and coastal area.[27]

Roadside Corridors

Roadside corridors take advantage of the existing need for human mobility to integrate animal mobility in the city network. Because roads are a major culprit of urban fragmentation, this transformation is particularly impactful. The guiding concept is a stretch of dense trees parallel to the road, so the cost is largely represented by the cost of trees.

Small Green Space Design

Smaller greenspaces such as green walls, native vegetation lawns, and green roofs provide stopping points along corridors, strengthening connectivity. They can also provide habitats for smaller taxa like arthropods, reptiles, and amphibians.[28] 

Additionally, there are many opportunities to implement small greenspaces in locations with government jurisdiction, making small greenspaces highly viable for smaller public projects.

A rooftop garden surrounded by grass. There are multiple rows of plants growing in the  garden.
Figure 6. The rooftop garden at KTP Hospital, Singapore.[29]

Some green rooftop projects in Singapore attracted as many as 32 species of butterflies and 24 species of birds. Beyond their utility for biodiversity, these green roofs have been demonstrated to capture and re-use approximately 12% of the rain water run-off.[30] 

As a relatively new urban phenomenon, green roofs have highly variable prices, particularly between intensive and extensive styles. Between Illinois, Germany, Brazil, and Portugal, the prices range significantly from 21.59 euros per square meter (in 2003) to 185.9 euros per square meter (in 2016) for extensive roofs.[31] The inflation and currency adjusted range is $33.94 per square meter to $221.72 per square meter.[32],[33]

Green walls are another relatively new urban design. In Genoa, Italy, direct green facades can cost between 30 and 45 euros per square meter, an indirect green facade can cost between 26 and 215 euros per square meter, and a modular green wall can be 315 euros per square meter (all in 2013).[35]

A wall coverered in plants on a building at Hougang School. There are windows and smaller plants under the windows.
Figure 7. The green wall at Hougang School, Singapore.[34]

According to an analysis of green wall economic sustainability, extensive or indirect green walls are often more economically sustainable.[36] The currency and inflation adjusted range of indirect facade wall installation is $45.18 per square meter to $67.77 per square meter. 

The most common public jurisdiction buildings are public schools and universities, making them excellent candidates for small greenspace implementation. The Virginia Department of Education guidelines for public school facilities describes classroom space requirements which indicate that there will be at least one external wall of around 9 square meters and at least one segment of rooftop of around 37 square meters.[37]

These designs represent the best of the greenification efforts of various cities. Put together as a unified, comprehensive plan for expanding cities, these projects can initiate an impactful shift toward urban biodiversity preservation. When applied to the urban expansion model of Las, Vegas, the feasibility of large scale implementation is revealed. Human development does not have to be unsustainable, but can be successfully integrated with the present wildlife. This is the aim of Terratopia. 


[1] Beninde, J., Veith, M., & Hochkirch, A. (2015). Biodiversity in cities needs space: A meta-analysis of factors determining intra-urban biodiversity variation. (Haddad, N. Ed.). Ecology Letters 18(6), 581–92. https://doi.org/10.1111/ele.12427.

[2] Ibid.

[3] Nielsen, A. B., van den Bosch, M., Maruthaveeran, S. & Konijnendijk, C. (2013). Species richness in urban parks and its drivers: A review of empirical evidence. Urban Ecosystems 17(1), 305–27. https://doi.org/10.1007/s11252-013-0316-1.

[4] Ibid.

[5] The Trust for Public Land. (2019). Which city is best for parks? https://www.tpl.org/parkscore.

[6] The Trust for Public Land. (2020). Everyone deserves a park within a 10-minute walk of home. Accessed November 14, 2020, https://www.tpl.org/city/minneapolis-minnesota.

[7] Ibid.

[8] U.S. Census Bureau. U.S. Census Bureau QuickFacts: Minneapolis City, Minnesota. https://www.census.gov/quickfacts/fact/table/minneapoliscityminnesota/PST045219.

[9] The Trust for Public Land. (2019). Which city Is best for parks? https://www.tpl.org/parkscore.

[10] Tempesta, T. (2015). Benefits and costs of urban parks: A Review. AESTIMUM 67, 127–43. https://doi.org/10.13128/Aestimum-17943.

[11] Ibid.

[12] Almeida, C.M.V.B., Mariano, M. V., Agostinho, F., Liu, G. Y., & Giannetti, B. F. (2018). Exploring the potential of urban park size for the provision of ecosystem services to urban centres: A case study in São Paulo, Brazil. Building and Environment 144, 450–58. https://doi.org/10.1016/j.buildenv.2018.08.036.

[13] Markets Insider. Euro to US-Dollar conversion | EUR to USD Exchange Rate Calculator. Accessed November 14, 2020, https://markets.businessinsider.com/currency-converter/euro_united-states-dollar.

[14] Bureau of Labor Statistics. (2019). CPI inflation calculator. https://www.bls.gov/data/inflation_calculator.htm.

[15] Christie, M. R., Knowles, & L. L. (2015). Habitat corridors facilitate genetic resilience irrespective of species dispersal abilities or population Sizes. Evolutionary Applications 8(5), 454–63. https://doi.org/10.1111/eva.12255

[16] Fernández‐Juricic, E., & Jokimäki, J. (2001). A habitat island approach to conserving birds in urban landscapes: Case studies from Southern and Northern Europe. Biodiversity and Conservation 10(12), 2023–43. https://doi.org/10.1023/a:1013133308987.

[17] MIT Senseable City Lab. (2020). Treepedia . Accessed November 14, 2020, http://senseable.mit.edu/treepedia.

[18] Ibid. 

[19] Landry, S. M., & Chakraborty, J. (2009). Street trees and equity: Evaluating the spatial distribution of an urban amenity. Environment and Planning A: Economy and Space 41(11), 2651–70. https://doi.org/10.1068/a41236.

[20] McElhinney, A., Harper, R. & Lass, D. A. (2018, May). What does it cost to plant a tree?Massachusetts Urban & Community Forestry Program: The Citizen Forester. https://www.mass.gov/doc/citizen-forester-may-2018.

[21] Vogt, J., Hauer, R., & Fischer, B. (2015). The costs of maintaining and not maintaining the urban forest: A review of the urban forestry and arboriculture literature. Scientific Journal of the International Society of Arboriculture, 41(6), 293–323. https://www.researchgate.net/publication/283711528_The_costs_of_maintaining_and_not_maintaining_the_urban_forest_A_review_of_the_urban_forestry_and_arboriculture_literature.

[22] Bureau of Labor Statistics. (2019). CPI inflation calculator. https://www.bls.gov/data/inflation_calculator.htm.

[23] Newman, P. Biophilic Urbanism: A case study on Singapore. (2013,August 13). Australian Planner 51(1), 47–65. https://doi.org/10.1080/07293682.2013.790832.

[24] Tan, K. W. (2006, April). A greenway network for Singapore. Landscape and Urban Planning 76(1–4), 45–66. https://doi.org/10.1016/j.landurbplan.2004.09.040.

[25] Republic of Singapore. (2020). The revenue and expenditure estimates for the fiscal year 2020-2021. https://www.singaporebudget.gov.sg/docs/default-source/budget_2020/download/pdf/revenue-and-expenditure-estimates-for-fy2020-2021.pdf.

[26] Newman, P. Biophilic Urbanism: A case study on Singapore. (2013,August 13). Australian Planner 51(1), 47–65. https://doi.org/10.1080/07293682.2013.790832.

[27] Ibid.

[28] Vergnes, A., Le Viol, I., & Clergeau, P. (2012, January 2012). Green corridors in urban landscapes affect the arthropod communities of domestic gardens. Biological Conservation 145(1), 171–78. https://doi.org/10.1016/j.biocon.2011.11.002.

[29] Newman, P. (2013, August 13). Biophilic urbanism: A case study on Singapore. Australian Planner 51(1), 47–65. https://doi.org/10.1080/07293682.2013.790832.

[30] Ibid.

[31] Almeida, C., Teotónio, I., Silva, C. M., & Cruz, C. O. (2020, April 7). Socioeconomic feasibility of green roofs and walls in public buildings: The case study of primary schools in Portugal. The Engineering Economist, 1–24. https://doi.org/10.1080/0013791x.2020.1748255.

[32] Bureau of Labor Statistics. (2019). CPI inflation calculator. https://www.bls.gov/data/inflation_calculator.htm.

[33] Markets Insider. Euro to US-Dollar conversion | EUR to USD Exchange Rate Calculator. Accessed November 14, 2020, https://markets.businessinsider.com/currency-converter/euro_united-states-dollar.

[34] Newman, P. (2013, August 13). Biophilic urbanism: A case study on Singapore. Australian Planner 51(1), 47–65. https://doi.org/10.1080/07293682.2013.790832.

[35] Almeida, C., Teotónio, I., Silva, C. M., & Cruz, C. O. (2020, April 7). Socioeconomic feasibility of green roofs and walls in public buildings: The case study of primary schools in Portugal. The Engineering Economist, 1–24. https://doi.org/10.1080/0013791x.2020.1748255.

[36] Perini, K., & Rosasco, P. (2016, December 2016). Is greening the building envelope economically sustainable? An analysis to evaluate the advantages of economy of scope of vertical greening systems and green roofs. Urban Forestry & Urban Greening 20, 328–37. https://doi.org/10.1016/j.ufug.2016.08.002.

[37] Virginia Department of Education Office of Support Services. (2013). Guidelines for school facilities in virginia’s public schools. https://www.doe.virginia.gov/support/facility_construction/school_construction/regs_guidelines/guidelines.pdf.

[38] Ignatieva, M., Haase, D., Dushkova, D., & Haase, D. (2020). Lawns in Cities: From a Globalised Urban Green Space Phenomenon to Sustainable Nature-Based Solutions. Land 9(3), 73. https://doi.org/10.3390/land9030073.

[39] National Cooperative Highway Research Program. (2005). Integrated Roadside Vegetation Management. Transportation Research Board. https://books.google.com/books?hl=en&lr=&id=HlE8Kx_8-3UC&oi=fnd&pg=PA12&dq=roadside+vegetation+cost&ots=LHxBsB6b8w&sig=9RRbZA33BiGNorVLrgAaDbBS4CE#v=onepage&q=roadside%20vegetation%20cost&f=false.