
Overview
Biodiversity is the heterogeneity of all Earth’s life forms: plants, animals, fungi, and microorganisms. There are significant links between biodiversity and ecosystem stability, as it fosters resilience necessary to withstand natural disaster, habitat destruction, human development, and climate change.[1]
As humans continue to exploit the planet’s resources, biodiversity suffers. According to the World Wildlife Fund’s 2018 Living Planet Report, there has been an average decline of 60% in the global species populations of mammals, fish, birds, reptiles, and amphibians since 1970.[3] The preservation of biodiversity on Earth is not only beneficial to wildlife but also to humans. Maintaining biodiversity increases the availability and stability of food, clean water, medicine, and shelter.[4]
Metrics
To assess the biodiversity of populations within the scope of urban greenification, the Terrascope Class of 2024 project utilizes four criteria: taxonomic diversity, genetic diversity, ecosystem diversity, and endemic species concentration because of their relevance to urban settings. These criteria are defined in more depth below. Biodiversity loss describes the decline of numbers, genetic variation, and species in a habitat, leading to a breakdown of the ecosystem and its surroundings. Scientists have warned that humans are entering the sixth mass extinction—nearly 60% of U.S. native vegetation and more than 500 animal species have been lost. Habitat degradation and other causes of biodiversity loss cost the global economy between USD 4-11 trillion per year from 1997 to 2011 in ecosystem services, as well as indirect costs in food waste and tourism.[5]
Taxonomic Diversity and Distinctness

Taxonomic diversity and distinctness are both measures of the taxonomic relatedness of a population.[6],[7] They utilize the path length, or “distance”, between individuals on a phylogenetic tree. Through this analysis, organisms that share a recent common ancestor would have a shorter distance between them on the tree.
Taxonomic diversity (Δ) is the average (weighted) distance between all pairs of individuals within a population.[8] Taxonomic distinctness (Δ*) is a similar measurement; it is the average (weighted) distance between all pairs of species in a population.[9] The main difference in calculation is that taxonomic distinctness ignores the paths between individuals of the same species. In practice, taxonomic diversity is a metric that includes aspects of taxonomic relatedness and evenness, whereas taxonomic distinctness is simply a measure of pure taxonomic relatedness.[10]
Taxonomic diversity and taxonomic distinctness are useful metrics of biodiversity because they go beyond the traditional species-oriented perspective of biodiversity by incorporating higher taxonomic ranks in their analysis.[11]
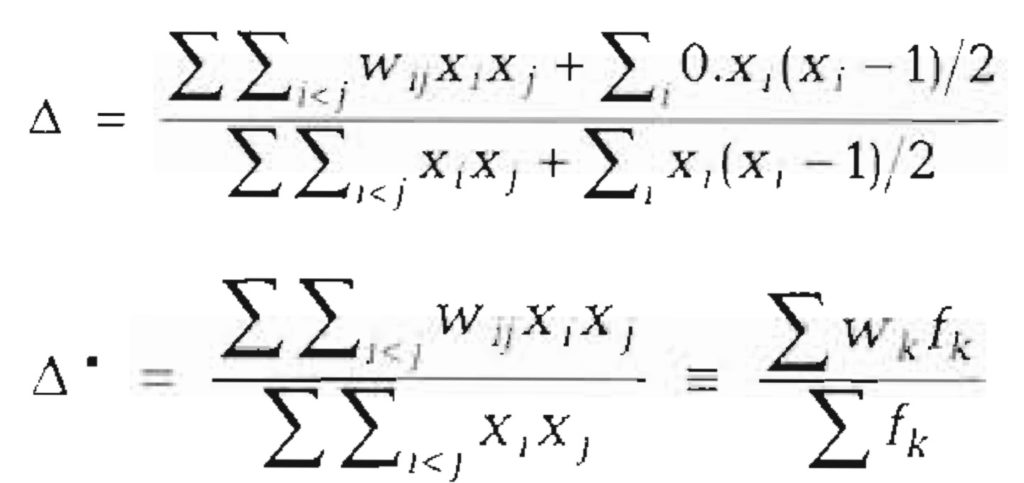
Additionally, both metrics appear to be less sample-size dependent than other common diversity measures, such as species richness and evenness.[13] To quantify these metrics, Clarke and Warwick’s taxonomic indices can be used (shown in Figure 3).
Genetic Diversity
Genetic diversity describes the genetic variability within species.[15] It is significant because increased genetic diversity can make a population less vulnerable to external pressures. Having a large gene pool, and thus more phenotypes and possible genetic combinations, increases the likelihood that an individual within that population will be resistant to significant change.[16] A functional example of this is a disease that affects certain individuals in a population. If each individual within a population were a clone, with identical genetic makeup, they would equally be susceptible to this disease. The entire population would be wiped out because of this shared vulnerability. However, increased genetic diversity would prevent a similar catastrophic event. This is because individuals within the population all have slightly different genetic makeup, decreasing the likelihood that the population has a common vulnerability.
This phenomenon of an extinction event is actually what happened to the Gros Michel strain of bananas in the 1950’s, since each tree was a clone of the other.[17]
Species Diversity
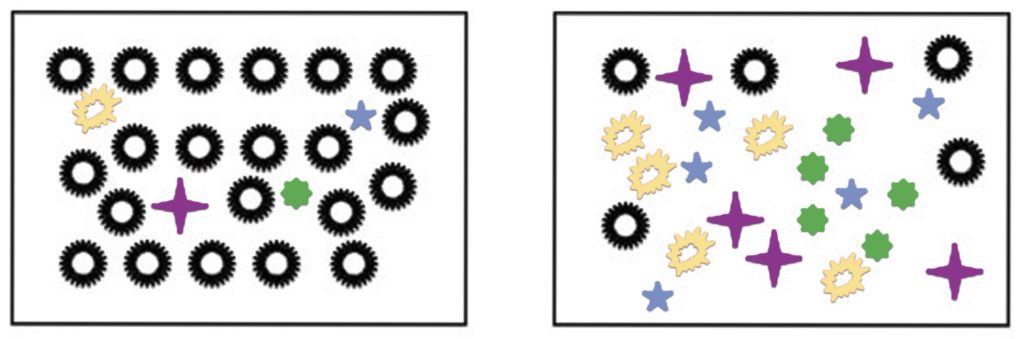
Species diversity can be quantified in several ways, but Terrascope Class of 2024 defines species diversity as a measure of the species richness and evenness of a population. Species richness is a basic count of the number of species in a community, without regard for the relative distributions of species throughout an area.[18] Species evenness measures the proportions of abundance between species. Evenness is higher when species are present in similar proportions.[19] These concepts are visually explained in Figure 4.
Species richness-evenness can be quantified using indices. A commonly used index within ecological literature is the Shannon diversity index.[20] Assumptions made for calculation are that individuals were randomly sampled from a large population, and all species are represented in this sample.[21],[22]
Endemic Species Concentration
Endemic species are species that are unique to a defined geographic area.[24] Measuring the relative abundance of endemic species to the rest of the population is an effective tool, because it provides insight to the biodiversity of the region as a whole.[25] This is due to the fact that the loss of endemic species often causes a global loss of species diversity—if there is a low concentration of endemic species within a region, it becomes more similar to surrounding regions, which would decrease biodiversity overall.[26]
Conclusion
After assessing the four criteria detailed above, Terrascope Class of 2024 chose to address biodiversity through the lens of urban greenification. This website presents a proposal to promote biodiversity urban spaces through adding, improving, and maintaining various green spaces within and around cities. The proposal is divided into three sections: reducing the harmful impacts of urban sprawl, introducing adaptive landscaping, and implementing alternative agricultural methods.