Costs
Terrascope Class of 2024’s Future Cities Proposal describes the growth of a city from having no green spaces and an initial population of 60,000 to having over 20% of the city’s area as green spaces and a population of 1.6 million. This cost analysis uses population and area metrics based on the growth of Las Vegas, Nevada from 1950 to 2000 and to estimate the costs of public trees, tree corridors, parks, green walls, green roofs, and park connectors.
Learn about the methodology behind this process here (on the design proposal page), or read more about the calculations here (on the background page).
Itemized Cost Estimates:
- Tree Planting Cost: $4.60/per tree
- Tree Maintenance Cost: $0.22-$8.98 per tree per year
- Park Maintenance Cost: $0.40 to $5.08 per m2 per year
- Indirect Facade Green Wall Cost: $45.18 /m2 to $67.77/m2
- Extensive Green Roof Cost: The inflation and currency adjusted range is $33.94 per square meter to $221.72 per square meter.
- Park Connector Corridor Cost: $515,400 per kilometer
| Per Decade: | Public Trees Cost Range | Roadside Corridor Cost Range | Green Walls Cost Range | Green Roofs Cost Range | Park Connector Cost | Park Maintenance Cost Range |
| 1950-1960 | $54,821,446-$154,455,442 | $567,950-$1,600,158 | $6,506-$9,759 | $20,092-$131,258 | $6,184,800 | $2,400,849- $30,490,785 |
| 1960-1970 | $71,121,495-$295,466,037 | $736,818-$3,061,028 | $12,199-$18,298 | $37,673-$246,109 | $734,445 | $1,708,3630-$21,696,218 |
| 1970-1980 | $91,524,050-$471,967,113 | $948,189-$4,889,579 | $23,584-$35,376 | $72,835-$475,811 | $821,548 | $2,138,336.00-$27,156,866 |
| 1980-1990 | $117,061,656-$692,891,158 | $1,212,758-$7,178,352 | $456,634-$684,951 | $1,410,241-$9,212,688 | $919,473 | $2,676,527.00-$33,991,886 |
| 1990-2000 | $149,026,735-$969,418,832 | $1,543,916-$10,043,179 | $88,237-$132,355 | $272,504-$1,780,190 | $1,029,769 | $4,023,819.00-$51,102,494 |
Figure 1. The costs of the public trees, roadside corridors, green walls, green roofs, park connectors and park maintenance over fifty years.
Total Costs
| Area of Expansion | Total Cost of Projects over Ten Years | Total Annual Cost Range | |
| 1950-1960 | 22,747,488 m2 | $64,001,643 – $192,872,203 | $6,400,164 – $19,287,220 |
| 1960-1970 | 28,472,727 m2 | $74,350,994 – $321,222,135 | $7,435,099 – $32,122,213 |
| 1970-1980 | 35,638,932 m2 | $95,528,542 – $505,346,293 | $9,552,854 – $50,534,629 |
| 1980-1990 | 44,608,776 m2 | $123,737,290 – $744,878,509 | $12,373,729 – $74,487,851 |
| 1990-2000 | 55,836,209 m2 | $155,984,981-$1,033,506,820 | $15,598,498-$103,350,682 |
Average Annual Cost per Area of Expansion: $0.273/m2 – $1.383/m2
Figure 2. A table listing the total area of expansion, total costs of the programs for over ten years, and the average annual cost for each decade from 1950 to 2000, where the average annual cost per area of expansion is between $0.273/m2 and $1.383/m2
Cost Comparison
As seen in Figure 1, the average cost per year of these programs in year 50 of the city’s growth would range from $15.2 million to $98.2 million. This large range is due to the costs of some of these installments varying based on the location and local government of the city, like the type of trees planted and the cost to maintain those trees. To evaluate the economic feasibility of this cost, it will be compared to the parks and recreation budget of several other cities. In the low range, Albuquerque, New Mexico has a population of 560,513 and a parks budget of 37.43 million in the fiscal year 2020.[1],[2] Directly applying that the proportion of the population to parks budget to the theoretical city to achieve a rough estimate of the economic feasibility, the park’s budget would be approximately 106.8 million dollars, which covers the cost range of the new programs proposed in the Future Cities: Design Proposal page. Using a higher range budget and city, Los Angeles, with an annual parks and recreation budget of $268.56 million and a population of 3.979 million a different proportion of the population to the park’s budget is achieved: $70.86 per person, which comes out to $111.4 million for Terratopia, which is still within the range of the proposal.[3],[4]
Benefits
While the total cost of urban park implementation and maintenance can be very sizable, the benefits provided by their presence is even larger when all impacts are considered. A 2015 study on the benefits of US urban park and recreation systems assessed the associated economic impacts on the urban atmosphere, urban noise, wildlife and biodiversity, city aesthetic, human activity and community, and real estate value.[5] Considering all of these factors, the study concluded a positive benefit to cost ratio across all cities evaluated.
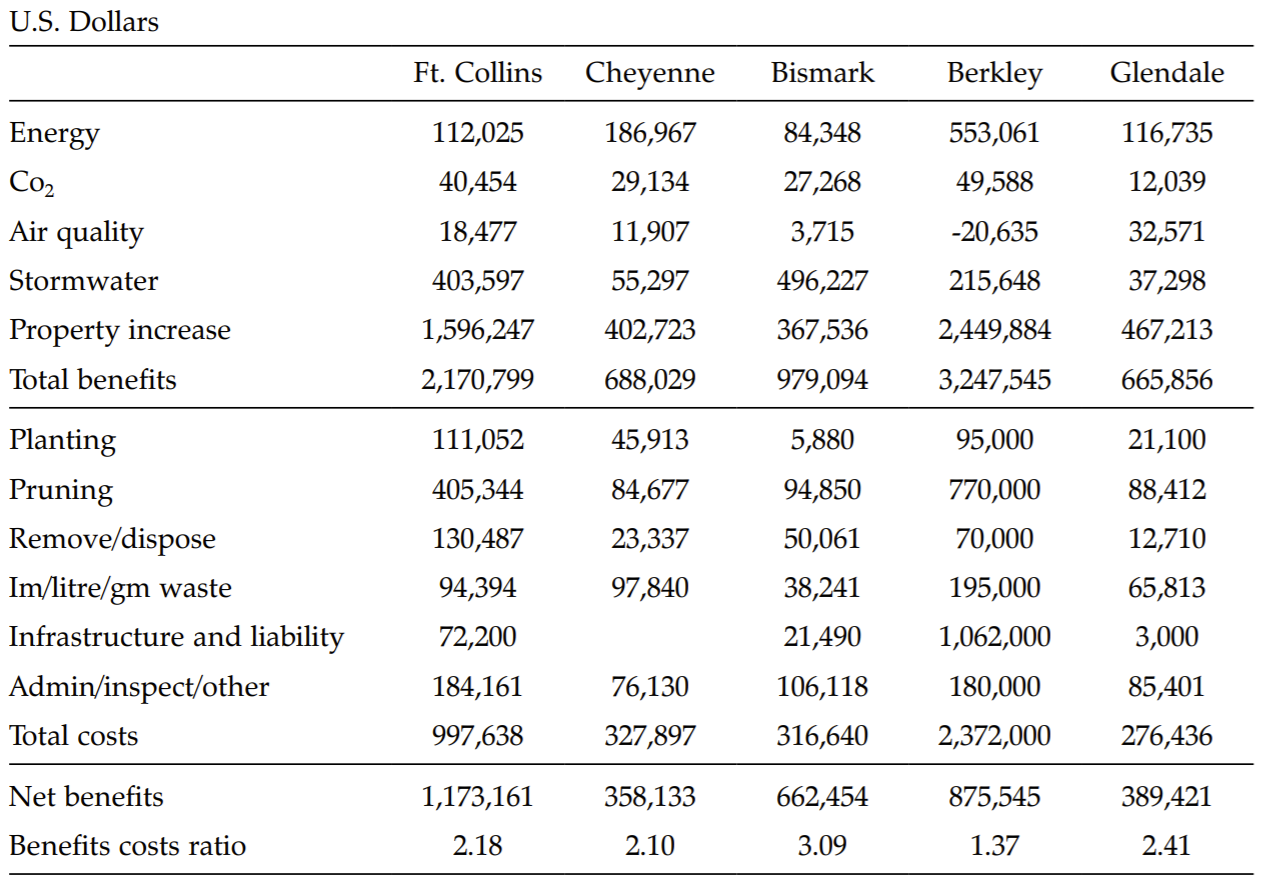
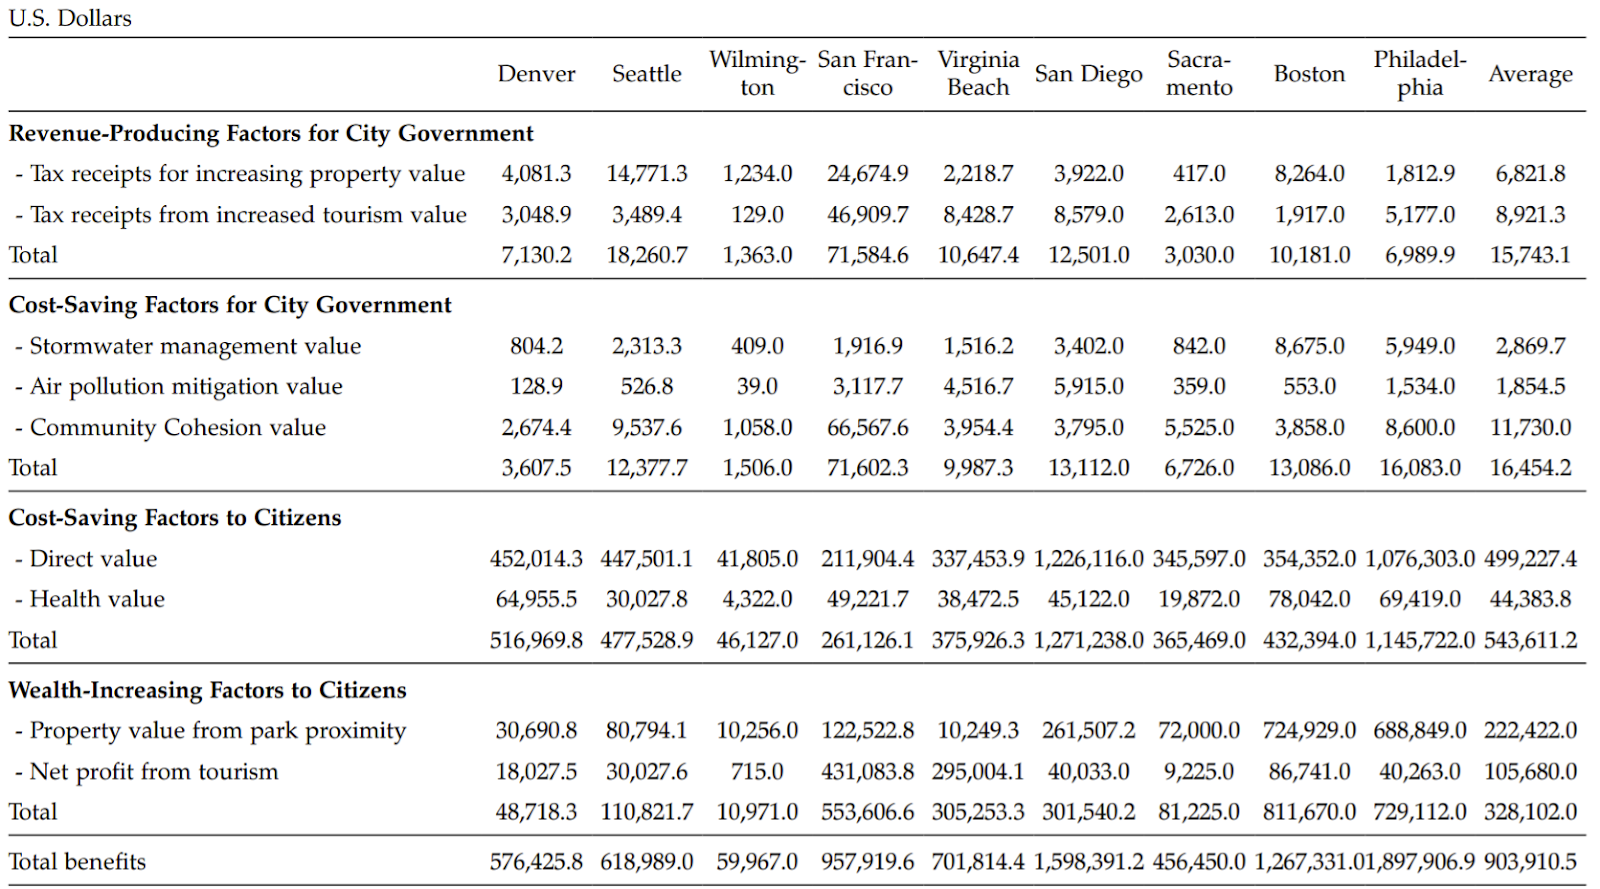
Figures 3 and 4 reference a variety of cities across the country ranging from around 350,000 people to 1.1 million people. The commonality across all of these cities is that the benefits to cost ratio in Figure 3 is above one for all the cities and the total monetary benefits listed for each city in Figure 4 all are greater than the cost range of the programs in the future cities proposal. While the proposed Terratopia has a population above 1.1 million, the strong commonality between these cities with such different populations suggests that the cost-benefit ratios would be similar. These figures show that the financial benefits of existing parks already outweigh the costs which sets an encouraging precedent for the cost-benefit ratio of the new green spaces outlined in the solution proposal. Other benefits of specifically trees include urban temperature cooling, carbon sequestration, dust and stormwater runoff interception, concluding a lifetime economic benefit of $25.09 per tree, which adjusted for inflation is $47.12 per tree according to a 2007 Tuscon study.[8],[9] Another 2007 study considers even more factors, namely energy conservation, urban atmosphere, urban wildlife and biodiversity, urban hydrology, community benefit, and real estate value.[10] Analyzing data from eight cities, the study found benefits between $23 and $64 per square meter of tree cover, which adjusts to $29.42 to $81.86.[11],[12]
Willingness of the public
The public is willing to pay for parks and green spaces. A study from Harvard and Colorado State found that Americans would be willing to pay 30 times more than the current annual amount of the national budget to preserve and maintain the National Parks Service.[13] While the greenification of Terratopia outlined in the solution proposal is not the same as a national park, citizens are also willing to pay to maintain their local green spaces. A study done by the National Recreation and Parks Association found that 4 in 5 Americans agree that local parks are worth the current tax dollars spent on them.[14] That high level of support and the monetary benefits enumerated in Figures 3 and 4 indicate the public would also react well to an increase in green spaces as outlined in the solution proposals.