In order to pursue any solution, Terrascope 2024 must set a clear metric by which solutions can be measured. The Group on Earth Observations Biodiversity Observation Network (GEO BON) has classified 20 candidates as biodiversity metrics into six categories, referred to as Essential Biodiversity Variables (EBVs).[1] GEO BON is well known for its success in achieving “an unprecedented level of integration of disparate efforts to measure biodiversity change,” as stated by a 2017 editorial in Biological Conservation.[2] This success makes their EBVs reliable and usable in biodiversity conservation projects like Terrascope. Also, these variables cover a very wide range of biodiversity indicators over various time frames and scales. Although the EBVs listed are very inclusive and thorough, staple biodiversity metrics like species richness and evenness were not included. However, Terrascope 2024 will use them.
Because there are 20 EBVs (besides species richness and evenness), it’s a necessity to narrow the list down to just a couple of metrics the Terrascope 2024 will use because some are not feasible or stray too far from the scope of our goals. In order to trim down the list of EBVs to a couple of feasible metrics, there are two criteria: timeliness and adaptability.
Criteria for Metrics
The criteria for metrics were selected based on the idea that metrics need to be able to be measured frequently (timeliness) and must be able to be measured within an urban environment (adaptability). This sets up a well-defined scope by which we will measure success—frequently and within cities.
Timeliness is defined as how often data can be produced from a metric. Metrics that perform best when measured monthly are preferable for the proposal. This is due to the need to build a robust dataset over monthly intervals that best suits the time frame municipalities expect from such a proposal, which follows the fiscal year.
A metric’s adaptability is defined as its success in urban environments and whether or not it can capture an adequate picture of biodiversity. A metric that can focus on one particular species or a limited set of species is far more suited for cities than say one that measures the entire ecosystem itself. Another aspect of this criteria is how equipment factors in. There will be limits on where and when some forms of equipment can be used based on local laws. Equipment like drones are limited by privacy and aviation laws, and satellite data may not provide the granularity that is required or may not be available.
Selected Metrics
With all the criteria for selecting metrics in mind, the list of 20 possible metrics has been lowered down to two metrics that cover most of the EBV classifications: Phenology and Net Primary Production. These are also accompanied by species richness and evenness.
Phenology is the measurement and logging of periodic biological phenomena like “bird migration or plant flowering,” which are linked to various environmental conditions.[3] This provides a significant amount of insight into the traits and behavior of the species that appear as part of the solution implementation. Since phenology is widely utilized as a part of studying species in general, this metric can make use of outside data on the traits of species to compare with collected results. This metric was selected because it is compatible with the plan for a monthly species census, which fits the criteria for timeliness. It also fits the adaptability criteria because it doesn’t require any equipment that may not adhere to local laws and one can isolate/focus on a certain species in the results. It also directly covers the classification for species traits. Phenology can also satisfy the community composition and ecosystem function classifications by providing insight on the prevalence of certain traits and what/when ecosystem-level cyclic traits appear.
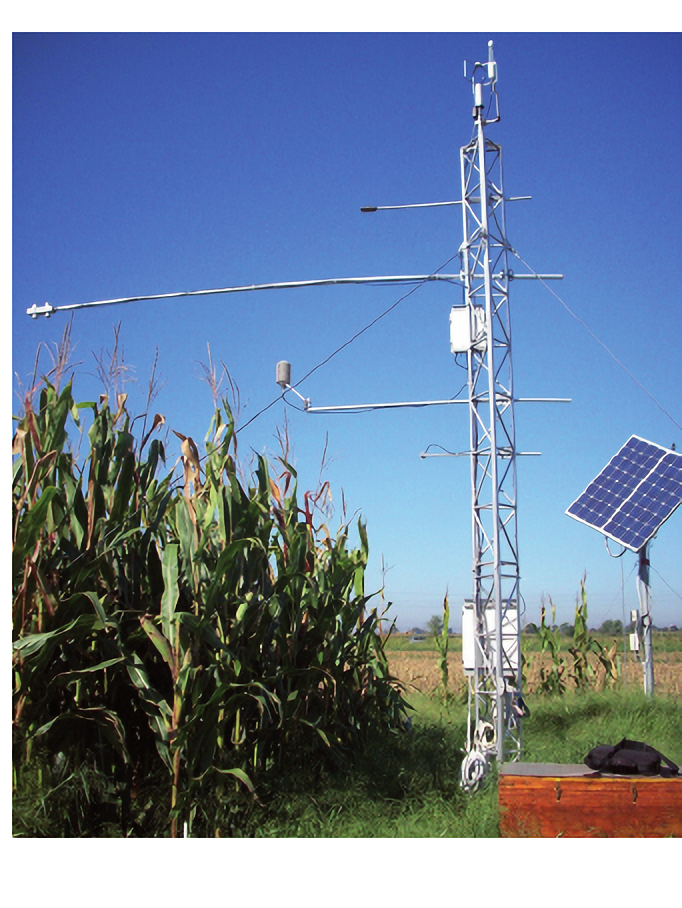
Net Primary Production is defined as “the rate at which energy is transformed into organic matter primarily through photosynthesis.”[4] Essentially, it’s how effective the ecosystem is able to produce the amount of energy necessary to sustain itself—the higher the productivity, the more successful the ecosystem. A way to measure this rate is using an eddy covariance tower, which “directly observe[s] the exchanges of gas, energy, and momentum between ecosystems and the atmosphere.”[5]
Eddy covariance towers feature a variety of sensors to achieve the observation of said exchanges, like high-performance CO2 (carbon dioxide) and wind speed sensors.[6] This combination allows for near-real-time measurement, which allows the ability to build a robust dataset over monthly intervals, which fulfills the timeliness criteria. Since an eddy covariance tower is just a setup of sensors over a certain area, it’d be trivial to place these sensors in a similar fashion in other ways, lending itself to being adaptable to urban environments.
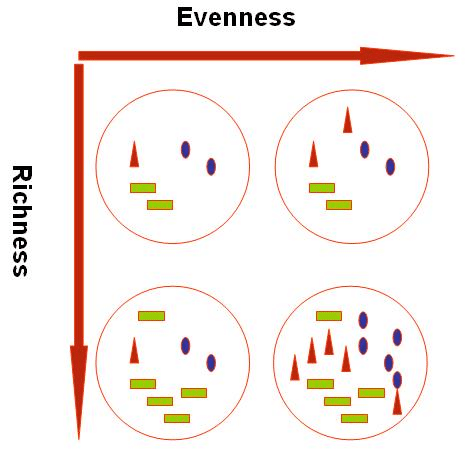
The last two of the selected metrics are staples within biodiversity studies, that being species richness and evenness. Richness is best measured using frequent censuses of species which, once again, has already been incorporated as part of Terrascope Class of 2024’s proposal. Using these censuses, the calculations of species richness can be tracked over time to see if it increases. This metric fulfills the species population classification for EBVs since it provides data on how abundant and distributed populations are in certain locations. On top of this, species evenness is another metric to measure by. This metric explains the composition of a community (one of the EBV classifications), which may be obscured by only measuring the appearance of species, like with species richness.
Both richness and evenness base its measurements on monthly wildlife censuses, which have been identified as a method that satisfies timeliness. Both of the metrics also can isolate a certain set of species, like key indicator species, from the data, which fulfills the adaptability criteria.
Conclusion
These four metrics—phenology, net primary production, species richness, and evenness—are key to the success of creating and maintaining healthy urban ecosystems sought for by Terrascope Class of 2024. All four metrics meet the two criteria—timeliness and adaptability—needed for being as metrics to be used going forward. As such, Terrascope Class of 2024 should look towards net increases across all four metrics, as an increase in these metrics is an indicator of biodiversity gains, something central to the project’s goals.